


Valuing the RGLS and VIGL CVRs

RGLS is exactly the type of thing I’m thrilled to roll up into a CVR. It makes the case for something like this a lot simpler. I no longer have to worry about financing risk, short-term market sentiment, how a small cap in a catalyst desert is going to trade, etc. No need to have concerns about whether a new drug will emerge, or how a generic launch of the SOC might impact future pricing. Both the risk and reward cases are clearly defined, and it simply boils down to whether one believes the drug works or not. There can still be other issues, generally with timing and the specifics of the milestone, but I don’t see either in this particular case.
The 8-K is very clear that accelerated approval would meet the milestone condition, and that is likely to occur in ~2029, 5 years before the required completion date.


2029 assumes that the registrational trial begins enrollment later this year, completes enrollment in 2027, so then 12-month TKV data is ready in 2028, which is then used to file for accelerated approval with priority review in 2029. The most likely delay here would be enrollment — doubtful, SOC is black boxed w/ REMS for liver tox, and treatment still results in increased TKV, while RGLS data offers some promise of decreased TKV. Whether or not that holds up is TBD of course, but I’d certainly expect interest in the trial. The June 2024 data slides indicate that even in this trial, 16% of patients had recently been on Tolvaptan.

Also, it could also see standard review given that it’s not an unmet need with the presence of Tolvaptan, but I wouldn’t consider this a material delay in the context of a few months versus a 2034 expiration date. And, this is also a roughly $1.5B drug (figures below in Yen), so the TAM here has already been proven out for finding potential patients to enroll. I think that estimated timeline is pretty solid throughout.

I also don’t see any material closing risk, which should be expected for a deal trading over the guaranteed consideration, but is worth addressing nonetheless. They had guided for a second half closing, but they’ve already launched the tender offer, which requires >50% of OS tendered, which is due to expire June 24th. Additionally, HSR should expire next week.


Novartis doesn’t have an ADPKD drug, so I don’t anticipate any regulatory issue, and shareholders through recent years should be happy with the valuation, satisfying a simple majority. Generally, issues with this would arise in retail-dominated stocks (who simply won’t tender at all), or in a case where major shareholders are unhappy with pricing, and I don’t think this falls into either bucket. I think it’s reasonable to expect that the deal could close toward the end of the month, assuming both of these conditions are satisfied as expected. Obviously capital constraint is one of the main issues here, and that only being the case for days or weeks, at least for the $7 component, certainly helps now.
As for the clinical data, I think it’s important to start with Tolvaptan for context. I linked the label when I first mentioned it, and the NEJM pub is available here. Otsuka ran a 3-year trial, both the publication and the label note that most of the separation between arms occurred in the first 12 months, presumably why that’s the new regulatory bar. TKV on Tolvaptan was +2.8% per year, while placebo was +5.5% per year.


The plot here shows that some individual patients in each arm saw benefit, but the majority saw increased TKV over time. I would again note here that in both arms TKV goes up.
In the RGLS data, it does not!
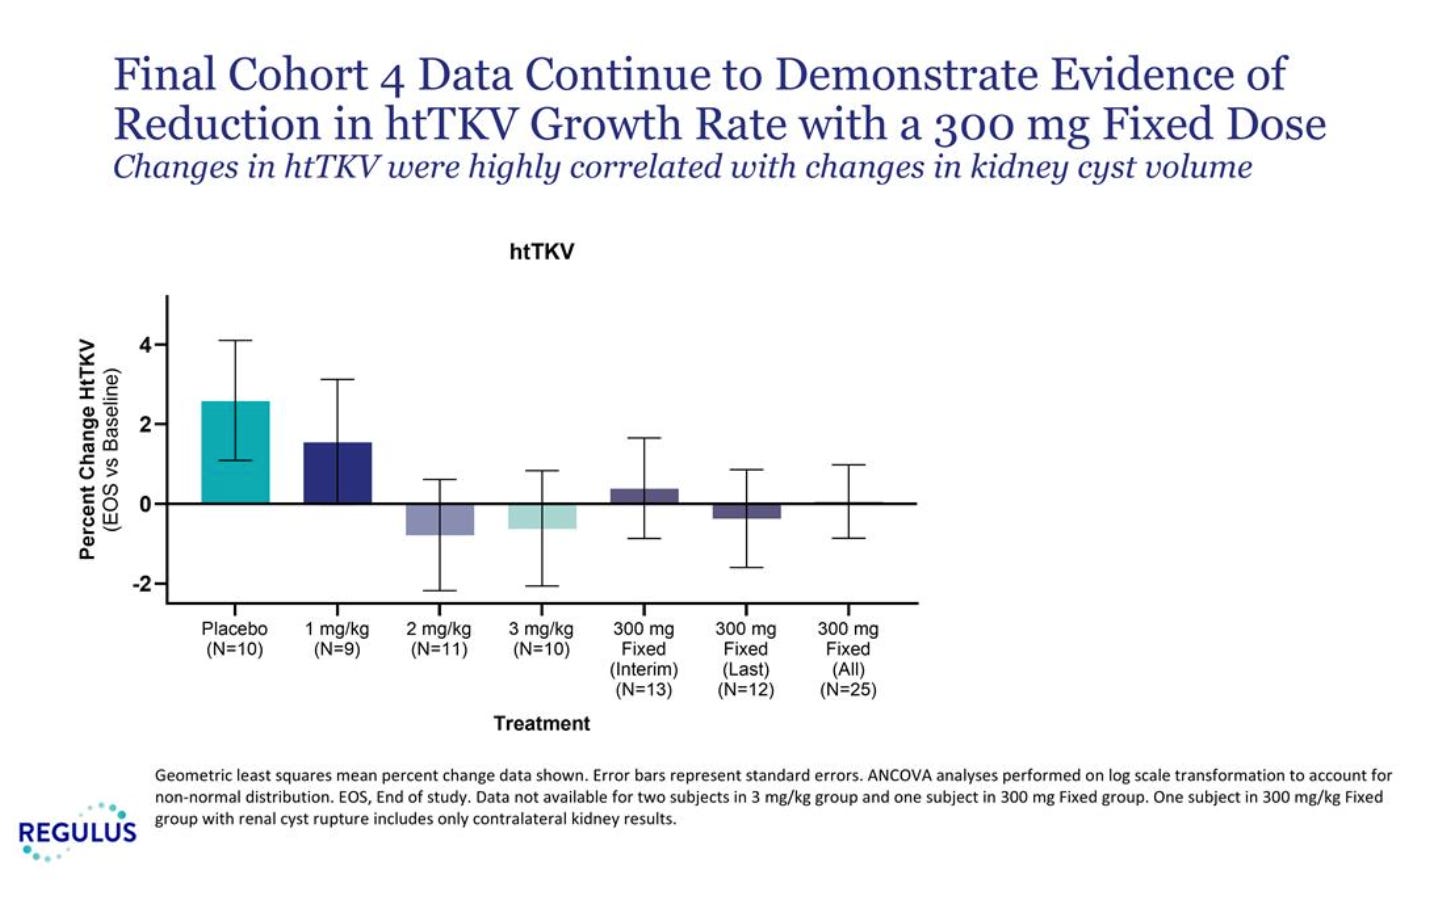
The placebo arm roughly tracks with the Tolvaptan placebo, just over 2% in RGLS’s 4-month study as opposed to 5.5%/yr. Definitely a bit higher, but pretty good for an n=10 sampling. Then on the treatment arm, there’s sort of a dose response… in that 1 mg/kg doesn’t work, but then 2 and 3 mg/kg, as well as 300 mg fixed, all seem to. In the context of the prior Tolvaptan data, and this placebo arm looking as one would expect, decreased/flat TKV is quite impressive to me. Sure, would it be preferable if there was a clearer dose response? Of course. I just think this is enough to say that this might be real, and the market is pricing that it is probably not.
I would also refer to the biomarker data, which tracks quite similarly with the TKV data.

The company argued, including prior to any data, that both PC1 and PC2 need to be hit for the drug to work. You can clearly see that the biomarker increases were greatest in 2 mg/kg, 3 mg/kg, and 300 mg fixed. This correlates quite well with the TKV data, with placebo the worst, minor potential effect at 1 mg, and then much better separation beyond that. In theory, 3 mg/kg should have had the greatest TKV benefit, but 2 and 3 mg were quite close, and demanding clearly greater separation might be too high of an ask for n=10 arms.
Looking at the baseline characteristics, I wondered if one possible alternative explanation for perceived drug effect was the baseline TKV differences.
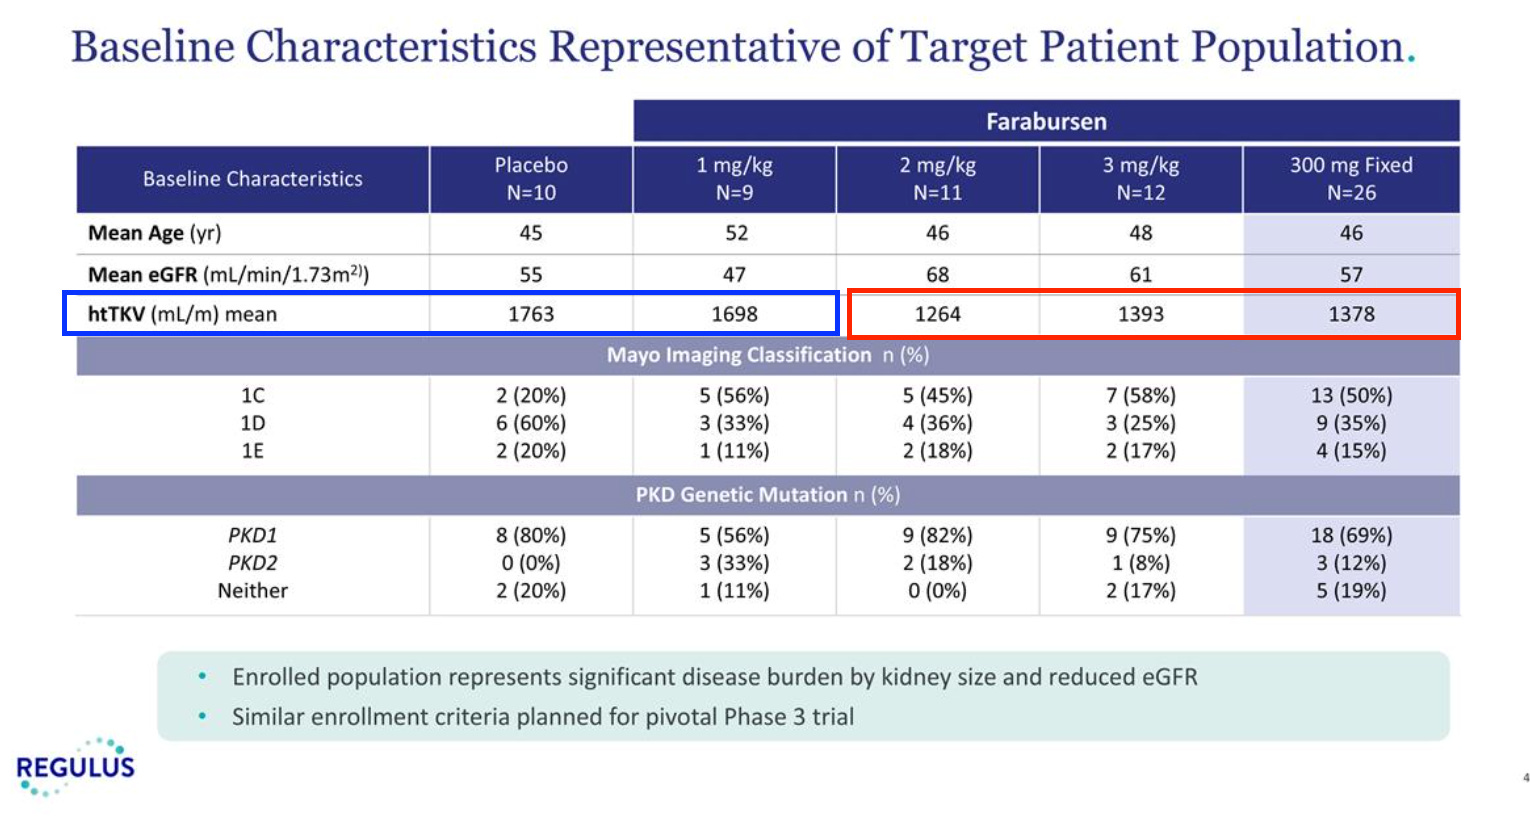
The placebo and 1 mg/kg arms clearly have a higher height-adjusted TKV than the arms that performed well. Exploring how this compares to the tolvaptan data, I have a couple of interesting points.

Tolvaptan shows a greater effect size in patients with greater kidney volume, but this is largely because placebo performs much worse. You can sort of argue this either way, that this would make placebo perform worse in the RGLS study, or that lower baselines in the RGLS study high dose arms would make it a little harder to show drug effect. The subgroup difference in the Tolvaptan study isn’t stat sig anyways, I don’t think any of this is a big deal either way, but it merits some discussion.
There are also other reasonable questions, like what is this EGFR data from last summer? Why wasn’t it updated with the Q1 data? What on earth does the chart on the right even show?

My counter to this is mostly just that TKV is the accelerated approval endpoint, and what happens beyond that is likely not our problem. Plus, Tolvaptan showing us that EGFR and TKV can correlate is likely more useful than their n=10 arm 4-month EGFR data anyway.
So, putting this all together, how should this be valued? It closed around 8.10 yesterday, with $7 back at closing likely this month, so risking a further ~1.10 over the next 4-5 years, on top of the capital constraint through June here.
Here is a quick and dirty table from GPT:
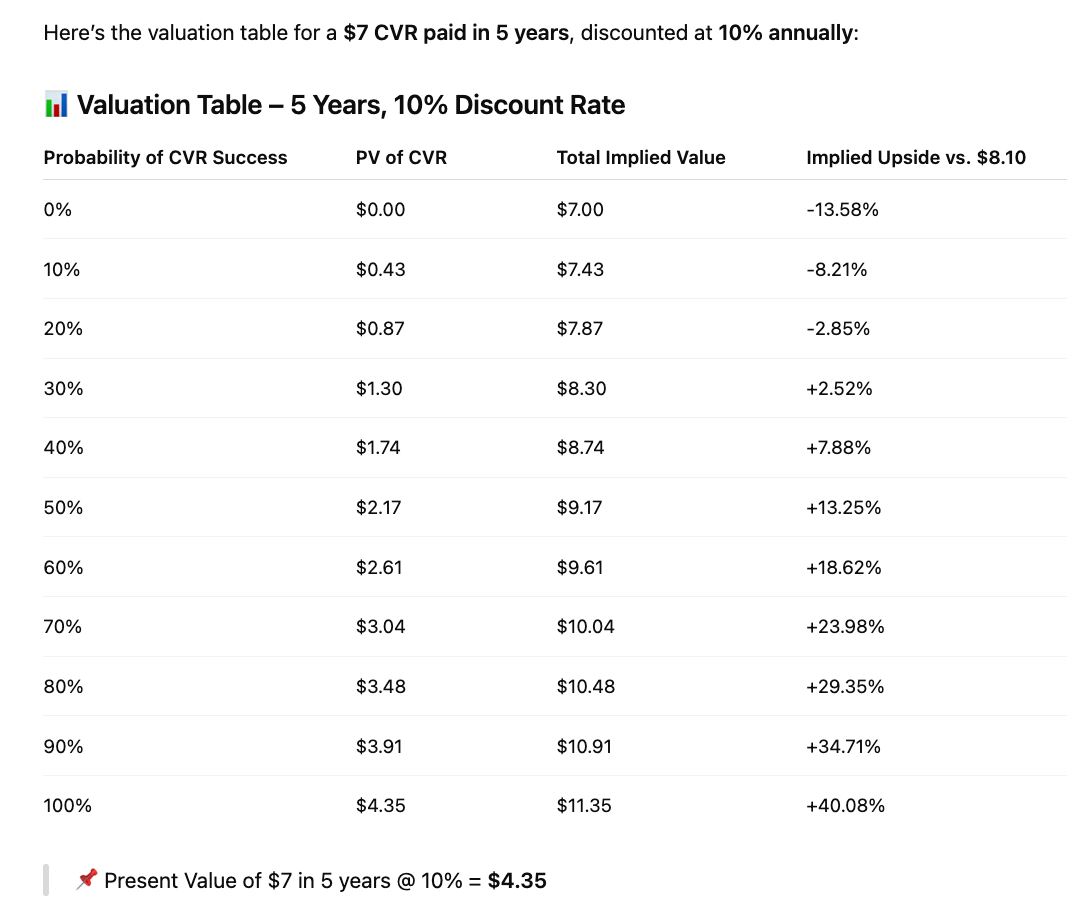
I think something like a ~40% PoS here is reasonable, and if the trial enrolls quickly, maybe even get a nice surprise there with payout pushed a year earlier. My guess is that it won’t trade quite that high into closing, but that’s probably what it’s worth to me. This will not be for everyone. Some will have issues with the capital constraint, or how to mark this for the next few years, maybe a preference for liquidity, etc. But me personally, I love to collect things like this that have a very reasonable/structural reason to be undervalued. It works for my situation, and I find that the explanation for this sort of thing being undervalued can be quite simple, yet frequently correct.